
Selected work

Questions, methods, and outputs.

Explore the scientific context and inspect the supporting report, analysis, or publication.

Public climate data · Sample report

Weather history with its methods attached.

How do temperature, rainfall, solar radiation, and thermal accumulation vary over a site's history?

AidWeather retrieves the NASA POWER series. AidWeather Report turns those values into a portable dashboard with charts, source context, and a methods page.

This report covers 138 days of a rainfed maize season near Jaguariúna, Brazil, from 18 February to 5 July 2022. Source-grid data describe climate context; they are not on-site sensor measurements or evidence of a treatment effect.
Public study · PRJNA1172690

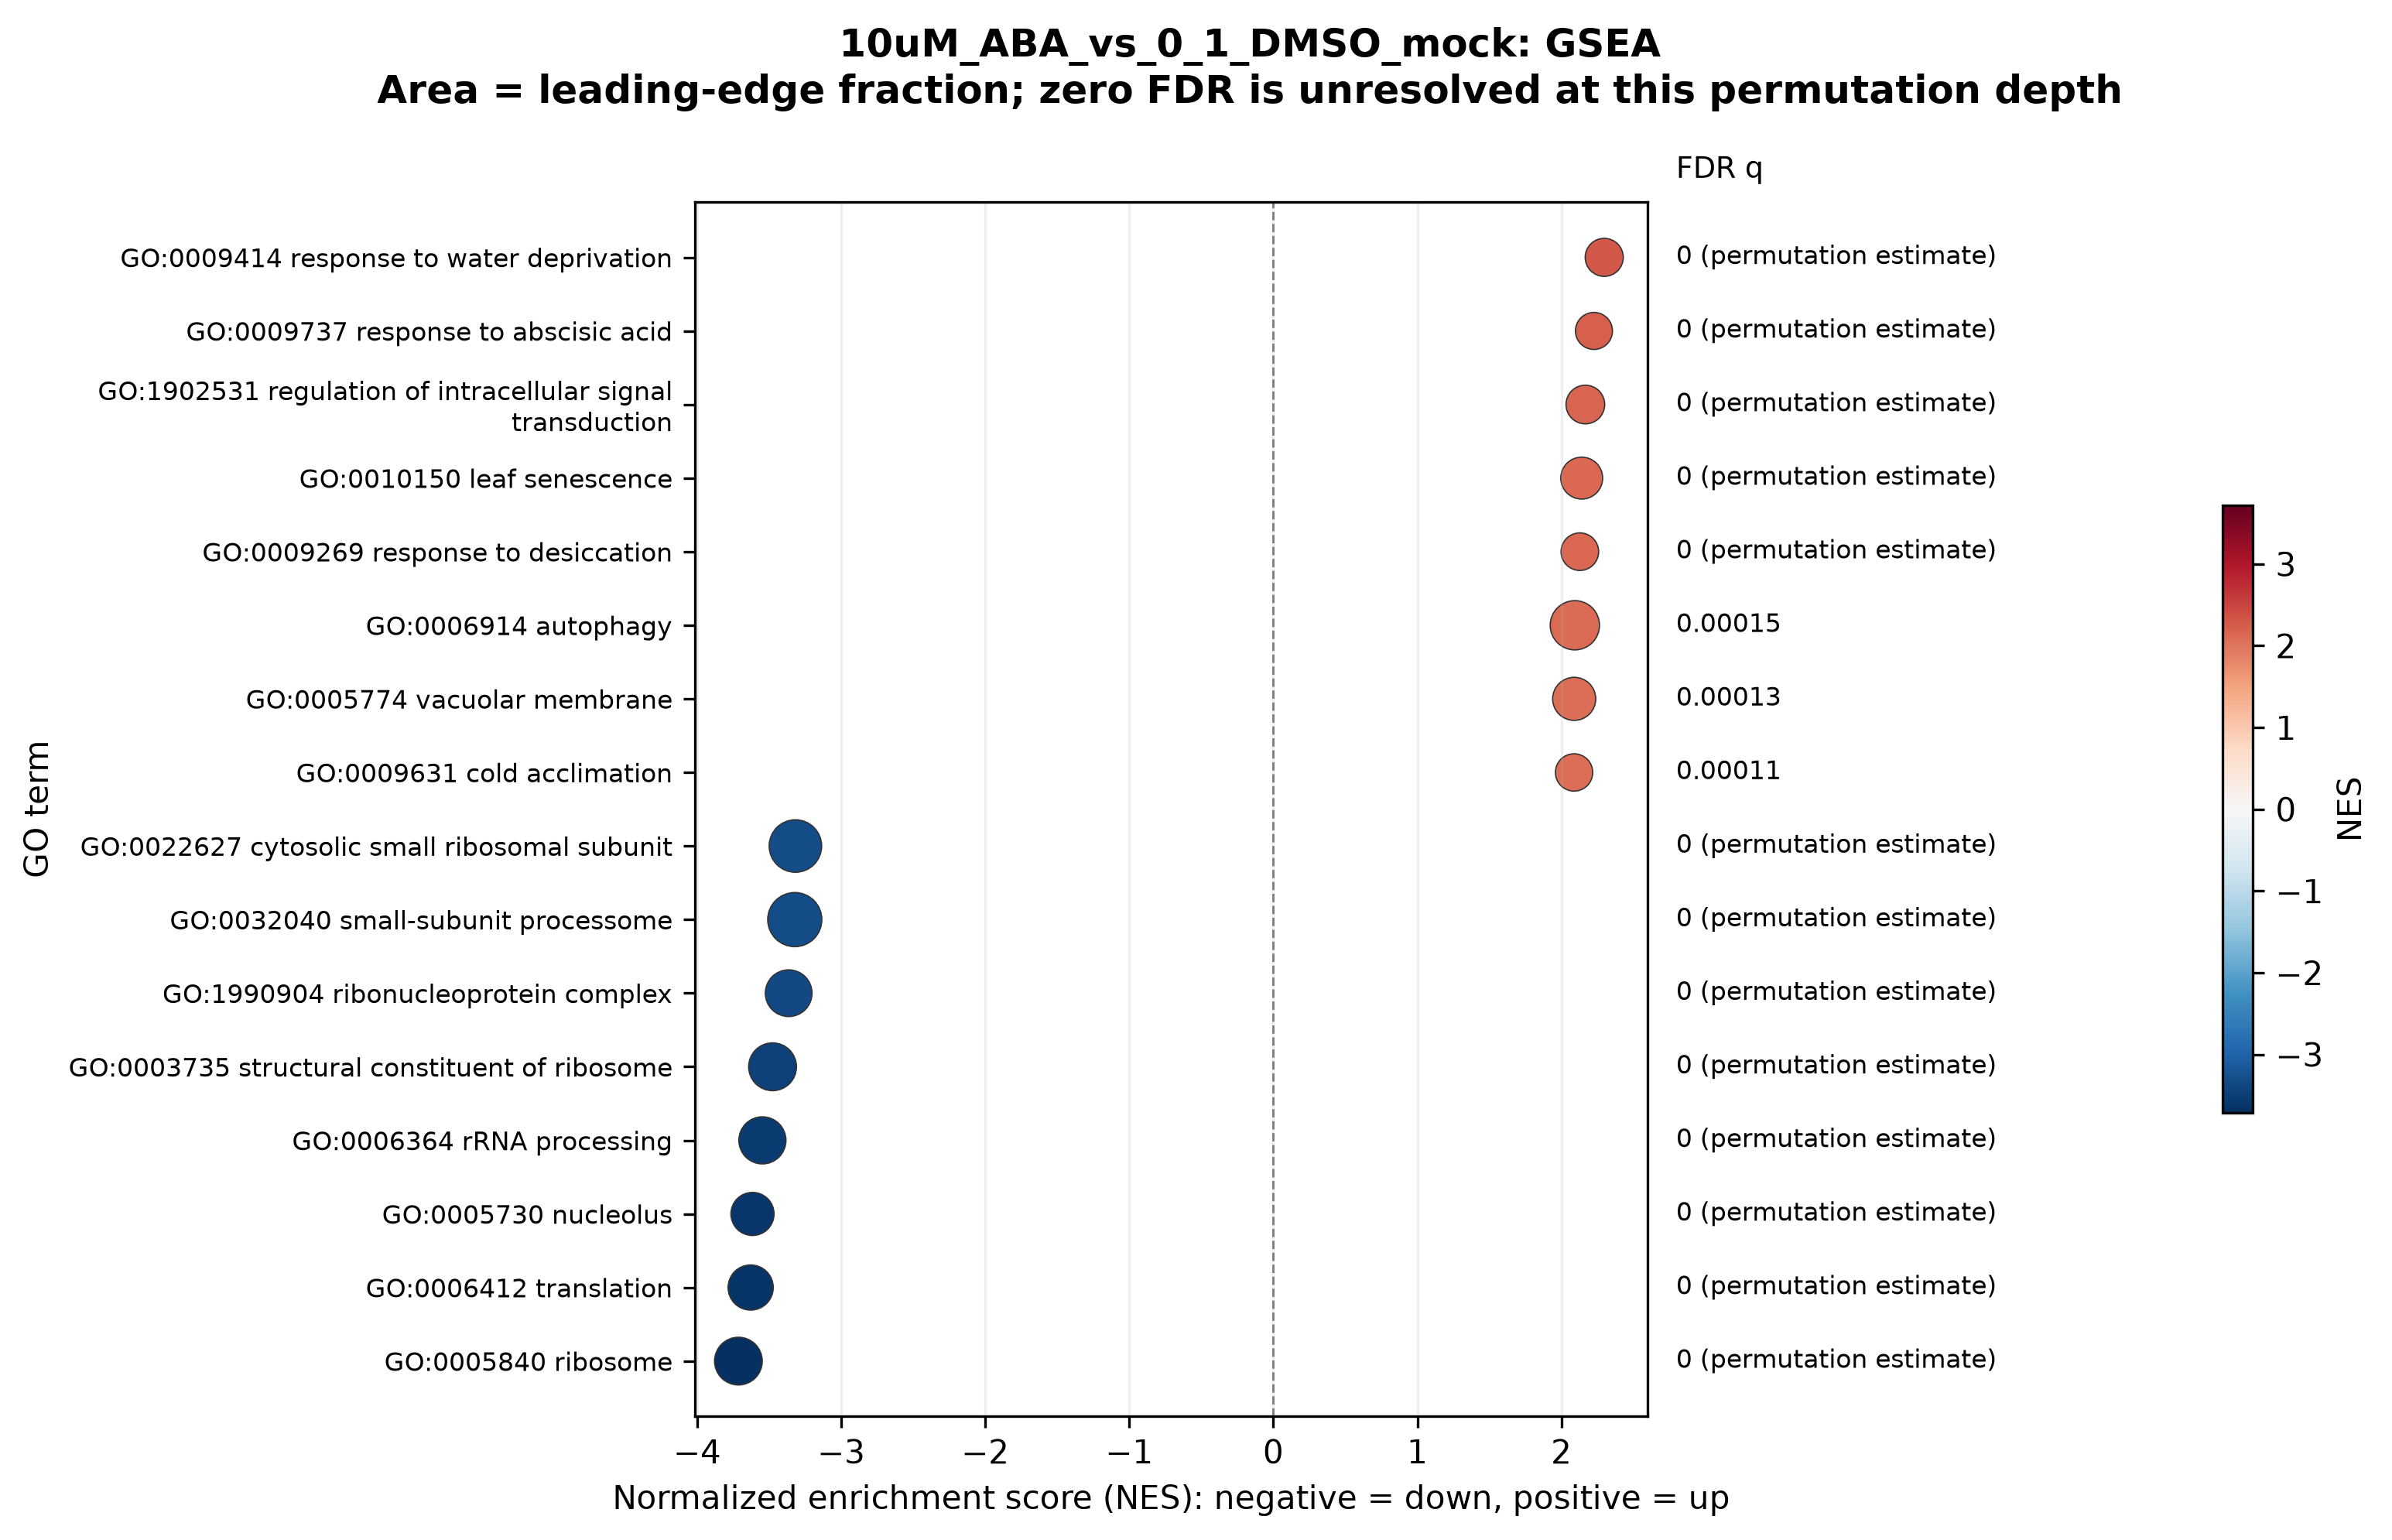
ABA and iCB, from samples to gene sets.

How do these two treatments each change Arabidopsis seedlings compared with a DMSO control?

Follow a reviewed AidCistrome design through PCA, paired volcano plots, gene views, GO bubble plots, an NES landscape, and PCA loadings.

Three biological replicates per group. ABA and iCB are separately compared with mock; no direct ABA-versus-iCB differential-expression test is presented.

AidCistrome GO bubble plot for ABA versus mock, Arabidopsis PRJNA1172690
Saved AidCistrome output from public data. Figure provenance.
Earlier public-study example · PRJNA968041

An earlier Arabidopsis case study.

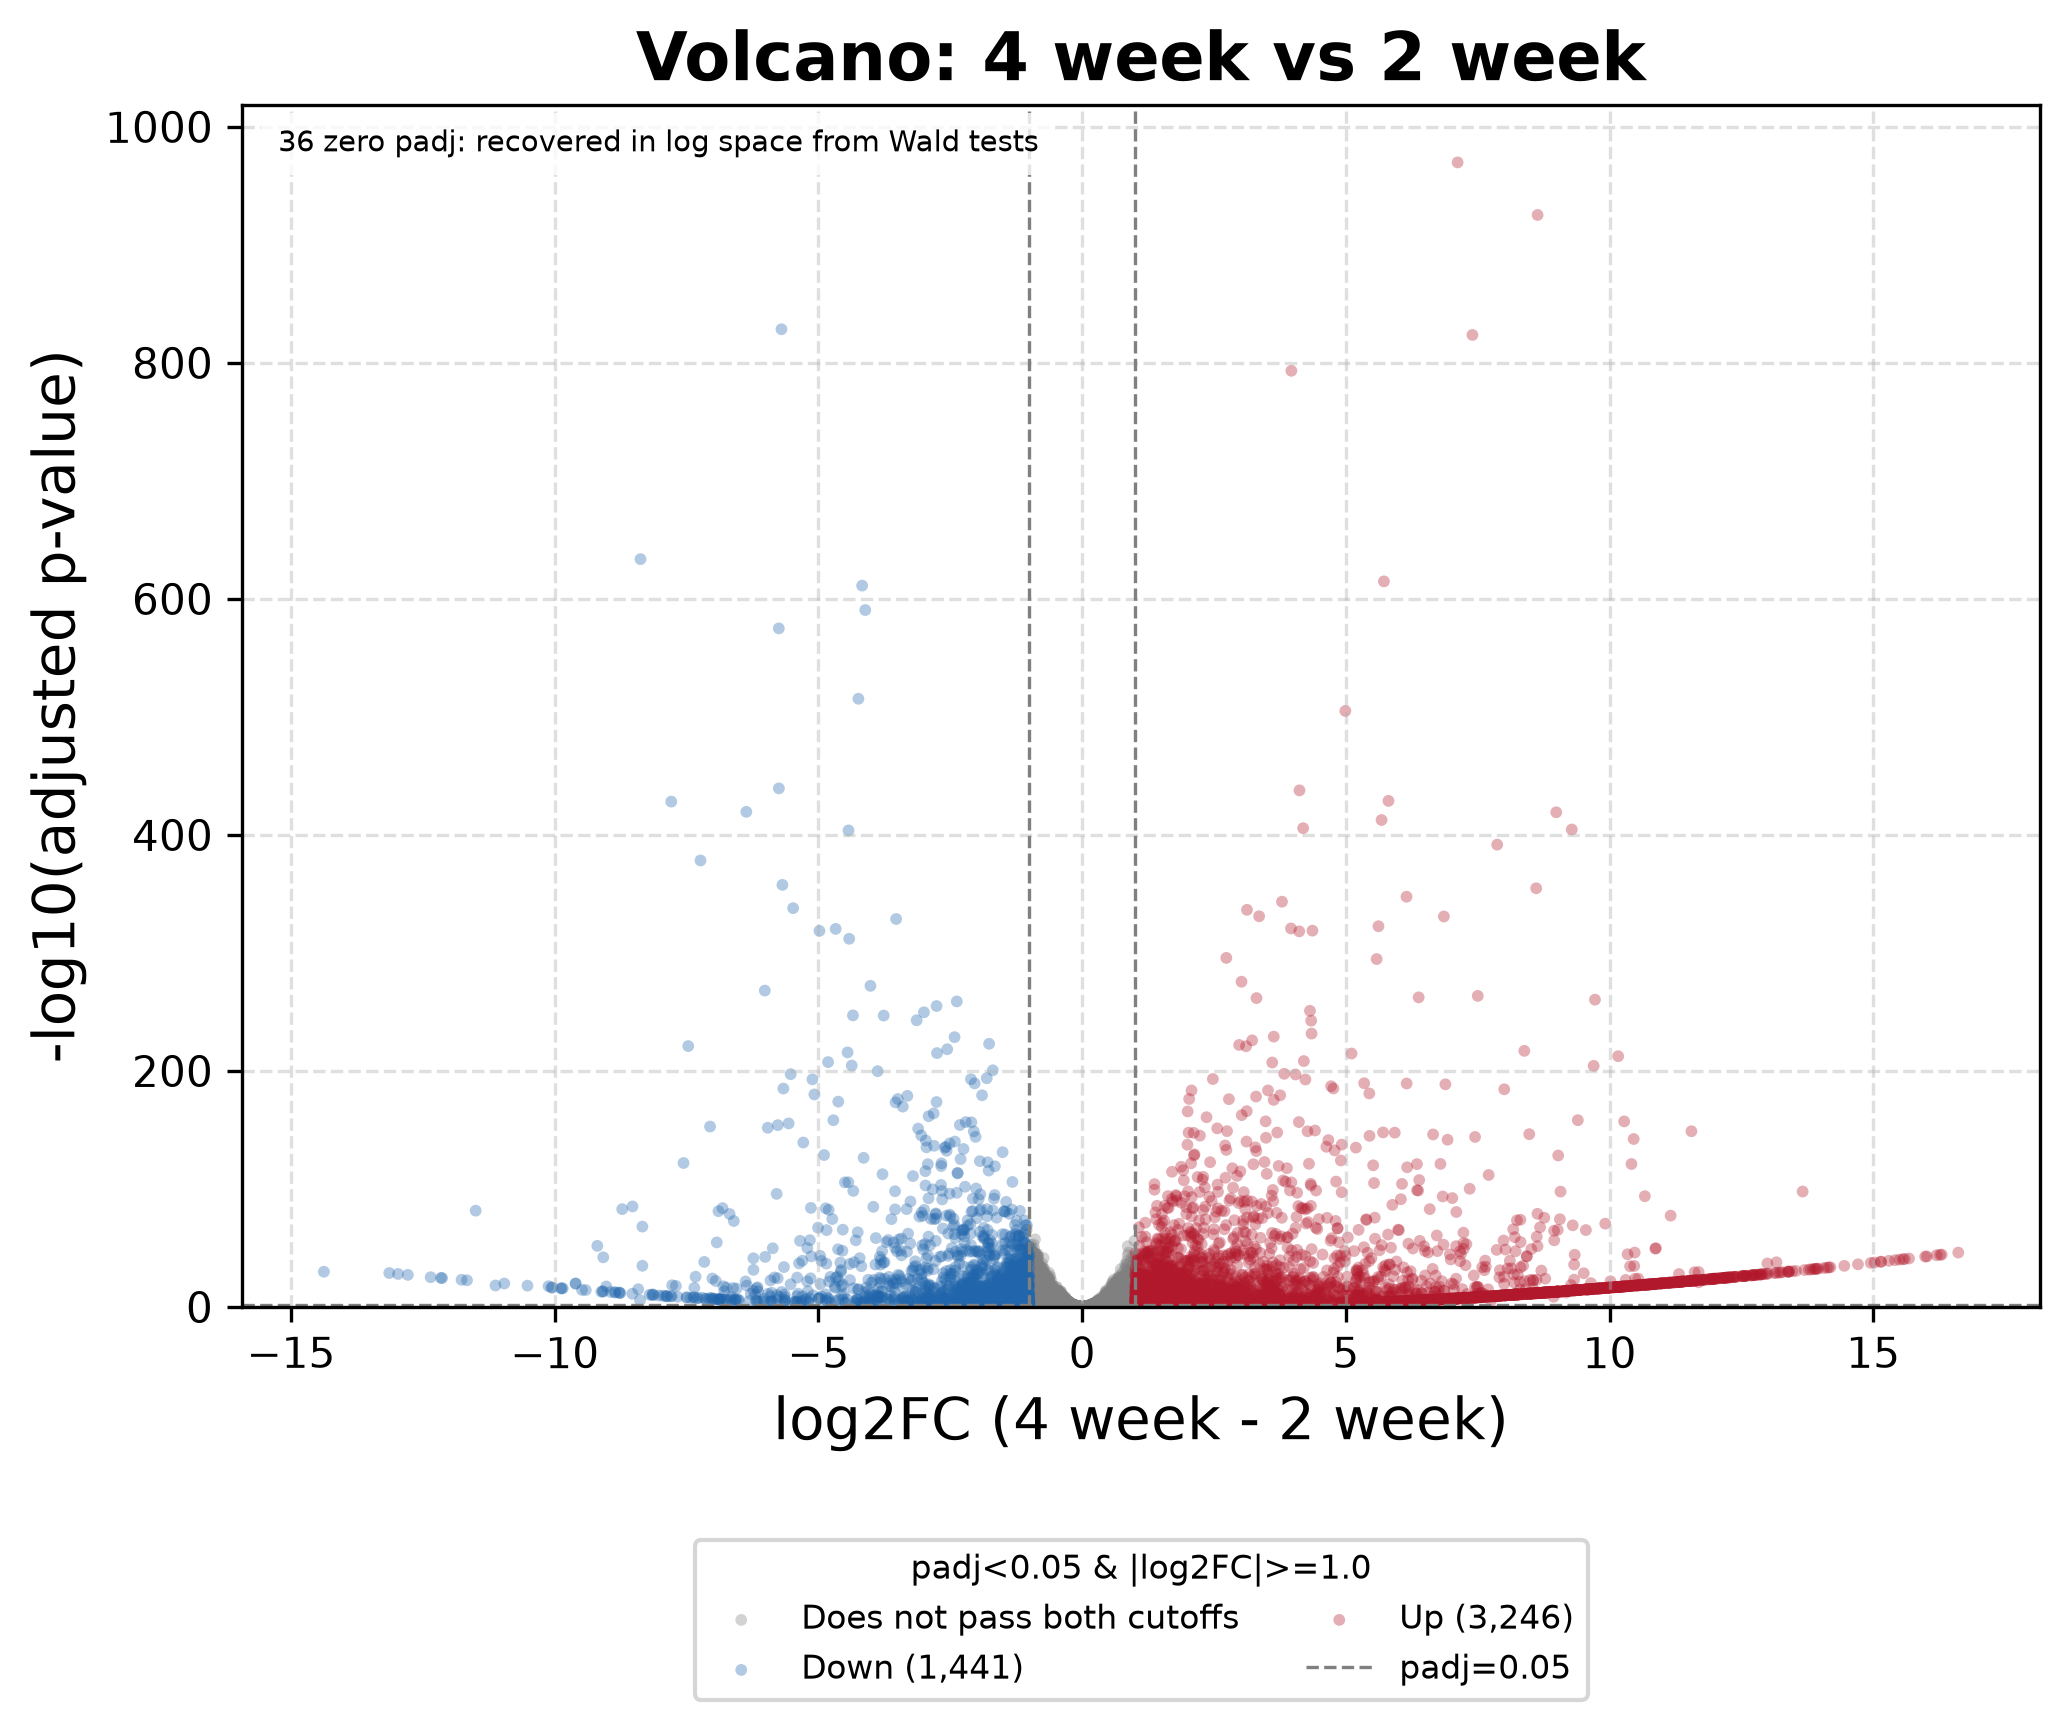
What changes between two-week shoot apices and four-week inflorescences?

AidCistrome connects a reviewed design with DESeq2, preranked GO enrichment and exploratory sample views. Inspect the volcano, GSEA, top genes, PCA, heatmap and MA plot, with full result tables.

Six Col-0 samples, three per group. Age and tissue differ together; the analysis does not separate their effects or establish a regulatory mechanism.

Original data: Tieqiang Hu, Xiaohui Li, Liren Du, Darren Manuela and Mingli Xu. PNAS (2023), 120(22): e2221181120.

AidCistrome volcano plot: Arabidopsis PRJNA968041, four-week versus two-week
AidCistrome output from public sequencing data. Provenance record.
Publication · 2026

Representing proteins as molecular graphs.

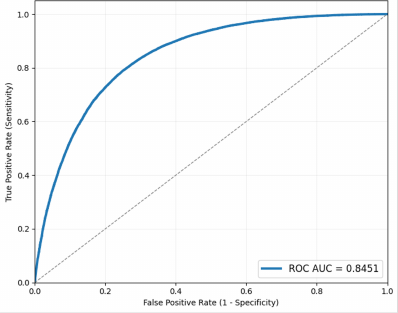
Can a model use protein structure to distinguish interacting protein pairs?

gPPIpred represents proteins as molecular graphs and uses a graph-based Siamese model for interaction prediction. The publication describes the evaluation protocol and its results.

Model scores and attention-based inspection are computational evidence. They do not replace an experimental interaction assay or establish binding residues.

Matiolli CC, Marques J, Abreu IA. gPPIpred: A User-Friendly PPI Predictor Based on Protein Molecular Graphs. microPublication Biology (2026). DOI: 10.17912/micropub.biology.001796.

Published gPPIpred ROC curve, Figure 1 panel d
Matiolli et al., 2026, Figure 1d. CC BY. Original panel retained; rights record.
Start a conversation

Have a dataset and a question?

Tell us what you want to understand, the data you have, and the output your team needs.

contact@aidbio.org